It would seem that we are all online.
If e-mail were a country, then its 1.4 billion users would make it the country with the largest population in the world. Over 92% of Americans have or read e-mail, and 66% of those do so on a daily basis.
In marketing terms, e-mails are a heck of a lot cheaper to generate than direct mail, thus driving up ROI. An analysis done by HubSpot in July 2013 of the ROI of e-mail marketing versus direct mail marketing found that it produced 95 times the ROI results than direct mail marketing.
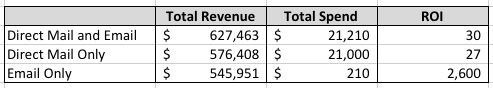
Image source: http://blog.hubspot.com/blog/tabid/6307/bid/34032/An-Investigation-Into-the-ROI-of-Direct-Mail-vs-Email-Marketing-DATA.aspx
That is to say, for every dollar invested in e-mail marketing campaigns alone, the test returned $2,600, compared to direct mail campaigns, where one dollar invested returned $27. So, it’s no wonder why e-mail marketing is so popular.
However, be aware that the HubSpot experiment above refers to ROI in general, which can always produce some pretty wild-looking numbers (even if they are true). A more conservative way of measuring email marketing results might be ROMI (return on marketing investment) or RPE (revenue per email), but even with more conservative measurement tools, it is clear that email marketing outperforms every other type of marketing channel a company has. The Direct Marketing Association puts it as follows:
- Email: $39.40 for every dollar spent
- Search: $22.38 for every dollar spent
- Display: $19.71 for every dollar spent
- Social: $12.90 for every dollar spent
But like any other tool touted as the next silver bullet, there are questions, such as:
- What are the meaningful indicators with which I can measure success in email marketing?
- Are there benchmarks in my industry sector that I can compare my results against?
- What are the top ways I can improve the results of my company’s email marketing campaigns?
Meaningful Indicators and Definitions
Open rate: The number of emails opened expressed as a percentage of the total number of emails sent. This is determined by a tiny, transparent tracking device embedded in the code of each email that once opened triggers a response back to the sender to say that the email has been opened. In general, the open rate tells you how effective your e-mail subject lines are performing, i.e., if the subject line is something that resonates with recipients and prompts them to open it.
Open rates are not a perfect indicator for the following reasons:
- Some email clients have a preview function on their inbox settings, so the email displays in the preview section and counts as “read” even if the client doesn’t open the email, thus counting it as a false positive,
- The invisible tracking code embedded in the email (to tell the sender where the email ended up) is a HTML image, so if a client’s email displays text only, the image doesn’t activate and the sender is told that the email wasn’t opened (even if it was), and most importantly;
- The fact that an email was opened doesn’t tell the sender if the client actually read it, skimmed it, or otherwise engaged with the content.
For these reasons, the open rate should be taken as a rough proxy for meaningful results – but of course it’s still better than nothing!
Click Through Rate: The number of recipients who click one or more links in an email and go through to the sender’s website, blog, or other desired destination. This number is also expressed as a percentage of total emails sent. In general, the click-through rate shows the level of engagement the recipient has with the content of the email – if they want to know more, they click through to your business’ website, if they’re not interested, they don’t.
Bounce Rates: A hard bounce rate is the percentage of e-mails that land on defunct email addresses and bounce back undelivered. A soft bounce rate is when emails are temporarily bounced, like when a person’s inbox is too full or if their inbox sends an automated “gone on vacation” or “out of office” message.
Industry Benchmarking
One of the most popular questions to do with email marketing is this: how do my email marketing results compare to others in my industry?
Most people want to know what would be considered an average and good email open rate or click through rate for their industry.
Benchmarking is of course important. However, be aware that benchmarking is particularly challenging for email marketers, for the following reasons:
- Some people calculate open rates using the total number of emails sent as the starting point whereas some use number of emails that landed or were received instead (subtracting the emails that bounced, etc.), so if you don’t know which method was used in the public average, you might be comparing apples to oranges,
- Open rates can often be influenced by sheer volume or frequency of email campaigns sent out (with open rates sometimes decreasing if too many emails are sent, etc.), so the average might be based on very different email marketing strategies of very different type companies (large versus small, services versus goods) within the same industry – and thus might not be a useful average against which to measure your own success, and;
- Degree of differentiation: keeping a healthy, active-email list is an essential part of being a great email marketer, as is segmentation (dividing up the list according to the special interests and needs of your client list, so that email content is more perfectly matched to their interests and thus more likely to be open and read). But some companies take good care of their lists and some don’t – meaning that the average bounce rate might be skewed.
The upshot is that “a good open rate for one type of email and address list may be a poor one for another. And the benchmark figures are based on a hotch potch of different lists and emails. Comparisons only make sense if you compare like with like.” (source)
As a general guide, the average reported unique open rate seems to hover around the 22-25% mark – lower if you’re a retailer sending out direct response, sales-type emails, and higher if you are sending out a sector-specific newsletter or informational content highly targeted to your list.
If you want specifics for your industry, you need to head straight for the biggest email handlers in the business, such as MailChimp and YesMail, who send out billions of emails a month to 8 million users – companies such as these carefully track open and click-through rates to give specific feedback to marketers on how their email campaigns are being received, with the result that they are in prime position to collate and report on data trends.
Here is a screenshot of a survey MailChimp did in August 2015 of open rates, click rates, and bounce rates across approximately 40 industry sectors – hundreds of millions of emails were scanned for this survey.
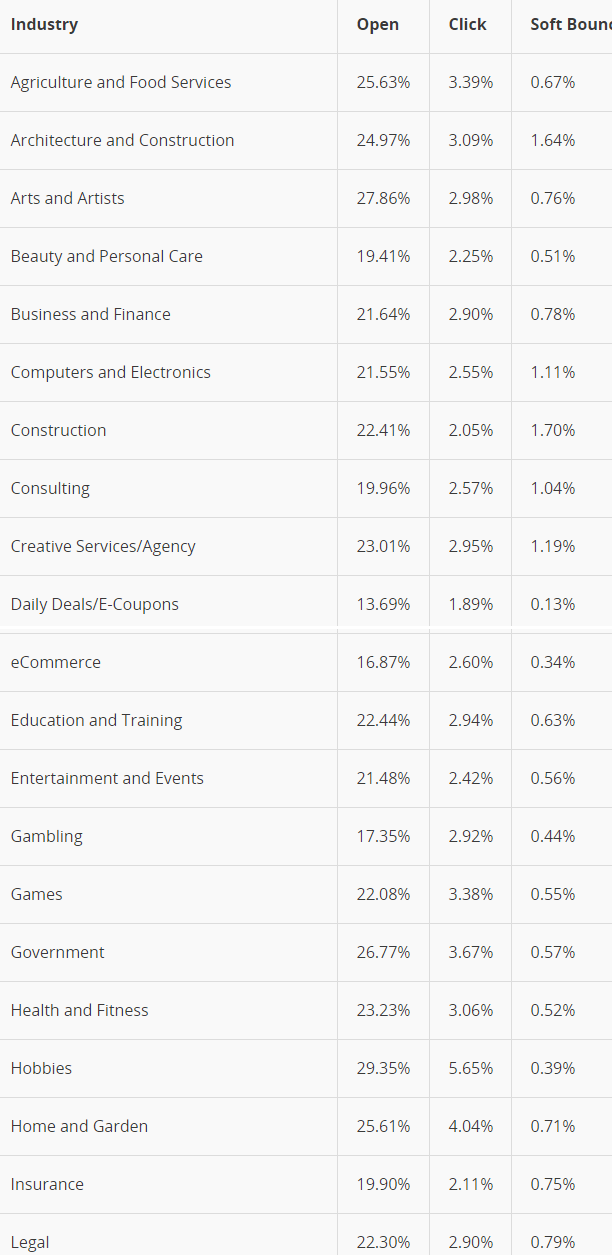
Image source: http://mailchimp.com/resources/research/email-marketing-benchmarks/?_ga=1.99613726.1472012616.1440671827
And here is a more consolidated survey (fields aggregated into larger industry categories) conducted by YesMail in 2014:
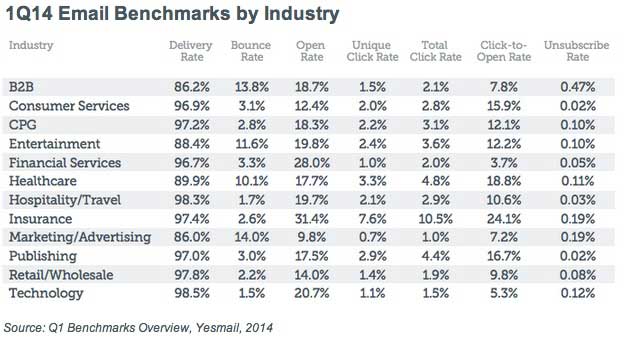
Image source: http://www.marketingprofs.com/charts/2014/25246/marketing-email-benchmarks-open-rates-by-industry-device-trends
And a survey focusing on larger volumes of emails from very large businesses and enterprises done by Silverpop in 2015 (the first chart focuses on unique open rates):
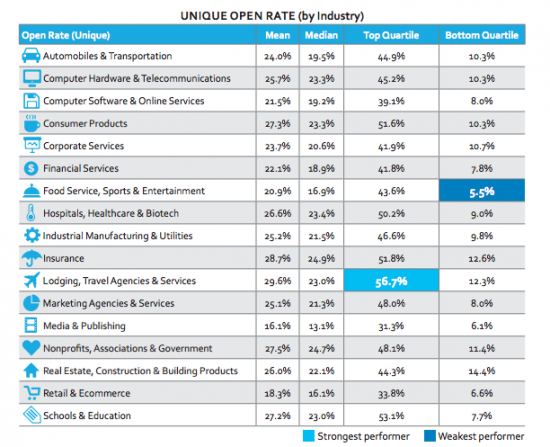
The healthcare, lodging and travel, insurance, not-for-profit, and consumer products industries have high unique open rates of between 26.6% and 29.6%, while media & publishing straggles in at 16%. For financial services, banks and insurance the average open rate consistently stands at around 22%.
Silverpop also includes a very useful analysis of Click-to-Open rates, which it believes are a far more telling indicator than the click-through rate (below) and advises that an average of 10-15% CTO rate is a good benchmark to aim for, no matter the industry.
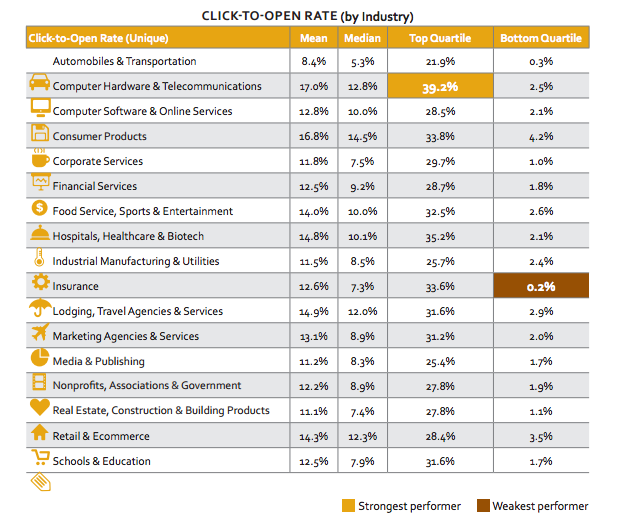
From this chart, we may surmise that the most significant client engagement with an email campaign happens within the computer hardware and telecommunications sector, but that there is a big drop off in client interest between opening and email and clicking through to content within the insurance industry.
Image source: http://www.smartinsights.com/email-marketing/email-communications-strategy/statistics-sources-for-email-marketing/
Top 6 Tips to Improve Email Campaign Results (Open Rates and Click Throughs)

Image source: http://unbounce.com/a-b-testing/glossary/
- Improve subject lines
Clients will make a decision to open your email (or not) based on how interesting they find the subject line, so put some research and effort into getting your subject lines are targeted as possible. Tell them what they’re going to see in the email in the most interesting and catchy way possible, for example:
“Top ten ways you’re crippling your business with Chrome extensions”
“5 ways to improve ROI that you can put into action today”
While you’re improving the subject lines, don’t forget to take a look at the sender line also: people don’t like opening emails from people they don’t know, so make sure that the “from” box is from a proper company name, and include a logo or symbol also to make your email stand out from others in a crowded inbox.
- Target, Target, Target – and then Segment
It is crucial when building an email opt-in list to know who your clients are, what they are interested in, and more importantly what they are NOT interested in, so that you can start crafting email content that will interest them and encourage them to engage (via click-throughs and click-to-open rates) and in turn decrease the percentage of abuse notices (which is when an email recipient reports your email as spam and blocks you). Then segment your email lists further, as if you were segmenting a market, to make your email campaigns as targeted as possible (thus increasing open and click rates). Email list segments could be along the lines of: current customers, potential customers, people who visited my site for information but took no action, people who downloaded my eBook, etc.
- Ask for access
When you send an initial email to members of an opt-in list, remember to kindly (and respectfully) ask them to make sure that they take action to treat your emails as “main inbox” material – in other words, to move the sender’s name to the list of senders allowed in the main inbox and taken out of other organizing sub-sections such as spam, commercial, or social categories that might hide your email from their eyes.
- Clean up your list regularly
If you have a higher than average bounce rate, run through your lists to cleanse any inactive or deleted email accounts from the list that might be skewing results. It’s simple really – the more emails that actually get delivered, the greater the chance that people will actually see (and respond to) them.
- Test Timing and Frequency
Although there is research claiming to show which hours of the day are the most effective in which to send out an email, we have seen how unreliable such averages can be even between two similar companies in the same industry, so use your instincts to gauge the right time for your clients. Volume (frequency of emails) is trickier to judge because send too many and you risk clients being turned off by your aggressive approach and responding by unsubscribing to the opt-in list, and too few and you risk not having much data to measure at all.
As a rule of thumb, two emails a week is too much to sustain a good open rate, and one a month (or less) risks your clients losing interest or forgetting you entirely. The magic figure lies somewhere in the middle (doesn’t it always).
- Responsive design
In the last four years or so, there has been a 500% increase in the number of people opening and viewing emails on their mobile devices (smartphones and tablets), as can be seen in the chart below:
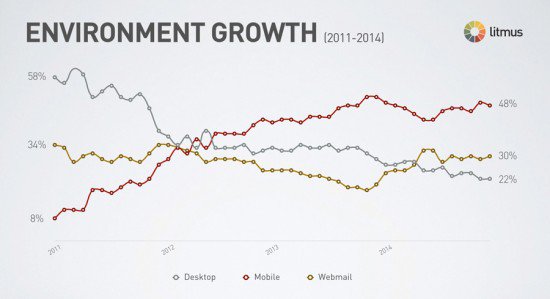
Image Source: http://www.smartinsights.com/email-marketing/email-communications-strategy/statistics-sources-for-email-marketing/
And yet the percentage of marketers who send out exclusively responsive emails (meaning emails that display their entire text and images completely to fit the dimensions of the screen of the mobile device) is a shocking 1%. Even if we count the people whose emails are halfway responsive, that leaves 75% of marketers who sent out emails that can only partially display on a mobile device – despite most recipients using a mobile device to view the email.
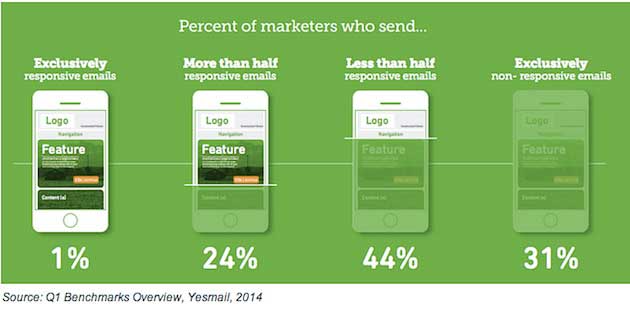
Image source: http://www.yesmail.com/resources/email-benchmarks/q1-benchmarks-overview-responsive-design-effect
Responsive emails, which automatically adapt to screen size, have been proven to command more engagement than non-responsive emails – they have a 21% higher click to open rate. This makes the low number of marketers who are actually using responsive design even more difficult to understand.
So, we leave you with this important advice – stay in line with your clients’ increased usage of mobile devices and make sure that the emails you send are exclusively responsive in design, so that more clients can actually open, view, and engage with the content of your emails.
0 Comments on "Analyzing Email Open Rates, Click Throughs & Statistics by Industry"